
The page you are looking for can not be found.


-
 Gas Guide Issue Vol: 5
-
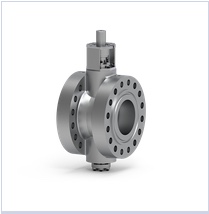 Triple eccentric butterfly valve from OHL Gutermuth
-
 Magcat® Textured Catalyst
-
 Custom Catalysts
-
 FCC catalyst solutions
-
 Podcasts from PAC
-
 Neles™ XH ball valves with forward-thinking design
-
 FCC online diagnostic services for FCCU
-
 Optimize heat exchanger efficiency
-
 Sulzer structured packings
SPONSORS